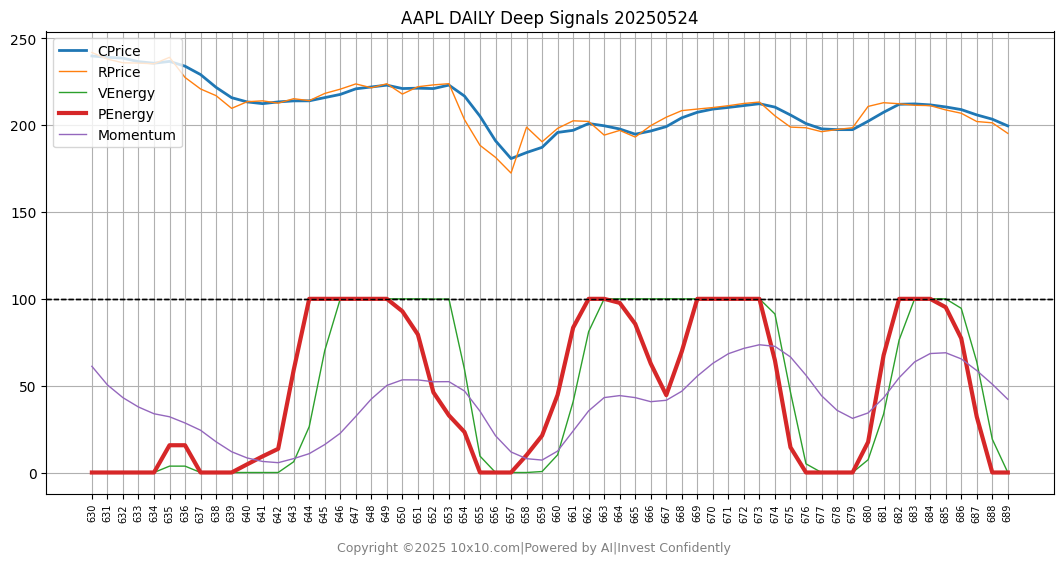
AI detected early breakdowns and breakouts in $AAPL with 10% in 5 days.
On May 9, 2025, 10x10 AiSignal detected early signs of an imminent market recovery.
The very next trading day, May 10, 2025, the Dow Jones surged by 1,161 points, and the Nasdaq soared by 779 points!
On May 20, 2025, 10x10 AiSignal once again detected emerging signs of market weakness, hinting at
an imminent correction. The very next day, May 21, 2025, the market reacted sharply when the Dow plunged
816 points, and the S&P 500 dropped 95 points.
Readers can view the AiCharts of QQQ and SPY on May 9, 2025, when PEnergy indicated an upward movement on
this page. On the same page, readers can see that the
AiChart for QQQ on May 20, 2025 showed a downward turn of PEnergy,
suggesting a potential leg down, which was later confirmed, in the following days.
Retail investors own 77% of the market capitalization in total via stocks held directly, mutual and pension funds.
They comprised 25% of total equities trading volume, nearly double the percentage reported a decade prior.
However, small retail investors often face several disadvantages compared to large financial
institutions when it comes to investing. They might not understand financial statements, corporate disclosures,
government filings, policies and regulations.
They usually have access to basic trading platforms provided by retail brokers, which might lack advanced
analytical tools, algorithmic trading options, and customized financial planning resources.
10x10 revolutionizes the way of investing by small retail investors to achieve financial freedom early.
By leveraging Large Language Models and AI technology, 10x10 brings
a suite of sophisticated tools and resources that were previously exclusive to Wall Street quant firms.
Our platform provides comprehensive data analysis, detailed and insightful signals that leverages
cutting-edge machine learning algorithms. This empowers retail investors to make informed decisions and implement strategies
with a level of precision and insight that parallels the capabilities of top-tier quant firms. With advanced AI tools and analytics,
10x10 enables retail investors to reap rewards with greater confidence and efficiency, similar to the way Wall Street's
elite investment firms operate.
Alpha Return
Alpha is calculated using the formula: Alpha = R - Rf - beta (Rm - Rf), where R is the portfolio's return, Rf is the risk-free rate, beta is the portfolio's systematic risk, and Rm is the market return. The formula is derived from: R = Alpha + Rf + beta (Rm - Rf). A positive alpha means the investment has earned more than expected, given its risk, suggesting good management or stock-picking skills. Alpha is a crucial metric for assessing the performance of active investment strategies, particularly those that aim to generate returns above the market average (e.g. SP 500). In simple terms, Alpha is used to describe an investment strategy's ability to beat the market.
Financial Assets
Assets are resources owned by a company. They can include cash, stocks, bonds,
property, and inventory. Assets are recorded on the balance sheet.
Balance Sheet
A balance sheet is a financial statement that provides a snapshot of a company's financial position at a specific point in time, showing what it owns (assets), what it owes (liabilities), and the remaining value for the owners (equity). According to GAAP, options, swaps, and contracts that qualify as derivatives are recorded on the balance sheet at fair value which is the value of the derivative (not the price of the underlying asset).
Beta Return
In finance, beta return refers to the portion of an investment's return that is directly related to the overall market's performance. It's a key component in the Capital Asset Pricing Model (CAPM). A stock with a beta of 1.5 might move 50% more positive than the market when the market goes up, and 50% more negative when it goes down.
Bull Market
A bull market is a prolonged period where investment prices rise faster than their historical average, as a result of economic recovery, boom, or investor psychology; these terms are most often used to refer to the stock market, but can be applied to anything that is traded, such as bonds, currencies, and commodities.
Bear Market
A bear market is a prolonged market period where investment prices fall, usually accompanied by widespread pessimism, as a result of economic recession, high unemployment, or rising inflation. A bull market is usually long. A bear market is usually short.
Bond
Debt issued for several years by corporations, governments, with the intent of raising capital by borrowing; a bond is the promise to repay the principal along with interest on a specified date; some bonds do not pay interest, but all bonds require a repayment of principal.
Capital Gain
The amount that an asset’s selling price exceeds its initial purchase price; a realized capital gain is an investment that has been sold at a profit, while an unrealized capital gain is an investment that has not been sold yet, but would result in a profit if it was to be sold.
Capital Loss
A decrease in the value of an investment or asset from the initial purchase price; opposite of Capital Gain. A realized capital loss is an investment that has been sold at a loss, while an unrealized capital loss is an investment that has not been sold yet, but would result in a loss if it was to be sold.
Capital Expenditure
The formula is: CapEx = (Ending PPE - Beginning PPE) + Depreciation Expense.
PPE is Property, Plant, and Equipment.
Example: In year end of 2024, company owns 1000 servers. In year end of 2025, Company owns 3000 servers. CapEx is the cost of 2000 servers and depreciation of all the 3000 servers. The cost of 2000 new servers cannot be counted as expenses. They must be depreciated.
Delta Risk
Delta risk in options trading, measures the sensitivity of an option's price to changes in the price of the underlying stock.
If a call option has a delta of 0.5, it's expected to increase in value by $0.50 for every $1 increase in the underlying stock's price.
Dividend
A taxable payment paid to a company’s shareholders out of the current or retained earnings, usually quarterly; usually distributed as cash, but can also take the form of stock or other property; provide an incentive to own stock in stable companies; usually paid by companies that have progressed beyond their growth phase and no longer sufficiently benefit by reinvesting their profits. A dividend on a stock is usually reflected on its 2X and 3X ETFs.
Equity
Stocks. Type of securities that represent ownership in a corporation and represent a claim on a proportionate share of the corporation’s assets and profits.
Free Cash Flow
Free cash flow (FCF) shows how much cash a company has left over after paying for expenses, making it an indicator of financial health.
Gamma
Gamma is the first derivative of delta and is used when trying to gauge the price movement of an option, relative to the amount it is in the money or out of the money. It describes how the delta will change as the underlying stock changes. So if an option's delta is +40 and the gamma is 10, a $1 increase in the underlying stock price would result in that option's delta becoming +50.
Income Sheet
Income sheet contains an income statement that is a financial report used by a business. It tracks the company's revenue, expenses, gains, and losses during a set period. Also known as the profit and loss (P&L) statement, it provides valuable insights into a company’s operations, the efficiency of its management, underperforming sectors, and its performance relative to industry peers.
Inflation
An overall general increase in the price of goods and services resulting in a fall in the value of the dollar; measured by the Consumer Price Index and maintained by the Fed at usually 2-3% annually.
Liquidity
The ability of an investment to be easily converted into cash with little-to no loss of capital, no price discount, and a minimum of delay.
Money Market
An account in which accumulated funds are invested in various short-term liquid securities. It can earn a higher rate of return than savings accounts.
Operating Expense
Costs incurred to run a business, such as rent, salaries, and marketing. They are tax deductible.
Recession
In the United States, the National Bureau of Economic Research (NBER) defines a recession
as a widespread downturn in economic activity, rather than strictly relying on two consecutive
quarters of negative GDP growth. Other countries, such as the United Kingdom and Canada,
use the two-quarter rule as a general benchmark.
Retained Earnings
Retained earnings (RE) are a part of the company's profits that have not been paid out as dividends. If a company does not pay dividends to its share holders, then all the net earnings essentially becomes retained earnings.
Savings Account
Guaranteed to earn interest. Low rates of return. Federally insured.
Swap
An equity swap is a financial derivative contract where two parties exchange cash flows based on the performance of an equity, like a stock or an equity index, against a fixed or floating interest rate. Example: Party A: A hedge fund (wants to bet Tesla stock (TSLA) will go up). Party B: A big investment bank (provides swap service). Underlying Asset Tesla (TSLA) stock. Bet TSLA can rise to $500 in 6 months. Swap Term 6 months. Notional Principal $10 million. Rate 1% fixed rate (paid by A to B). Settlement Cash only. Suppose after 6 months: TSLA rises from $300 to $500. A pays B 1% of $10M = $100,000. B pays A $6,667,000 gain from TSLA. Investment Bank B will usually hedge itself by: Buying TSLA shares, or, using derivatives so that it neutralizes its exposure to TSLA price swings. It profits mainly from the 1% fee. Suppose TSLA drops from $300 to $200 (33% loss). Then A must pay $3.333 million (loss) + 1% interest ($100k) to B.
Relative Strength Index
Relative Strength Index (RSI) is a momentum indicator used in technical analysis to measure the speed and magnitude of recent price changes. It helps traders identify potential overbought or oversold conditions and generate buy and sell signals.
MACD
MACD stands for Moving Average Convergence Divergence. It is a technical indicator used to identify changes in the direction, strength, and momentum of a stock's price trend. Specifically, MACD helps traders find potential entry and exit points for trades by analyzing the relationship between two exponential moving averages (EMAs) of a stock's price.
Bollinger Bands
Bollinger Bands are a technical analysis tool used to measure price volatility and identify potential overbought or oversold conditions in a market. They consist of three bands: a middle band (usually a 20-period simple moving average), an upper band (two standard deviations above the moving average), and a lower band (two standard deviations below the moving average).
Stochastic Oscillator
A stochastic oscillator is a momentum indicator in technical analysis that compares closing price to its recent high-low range over a specific period. It is used to identify potential overbought and oversold conditions and predict potential trend reversals. The oscillator's readings range from 0 to 100, with values above 80 often signaling overbought conditions and values below 20 suggesting oversold conditions.
On-Balance Volume
On-Balance Volume (OBV) is a technical analysis indicator used to gauge market sentiment by analyzing volume flow and price movement. It is essentially a cumulative total of positive and negative volume, aiming to identify whether smart money (institutional investors) are accumulating (buying) or distributing (selling) a stock.
Money Flow Index
The Money Flow Index (MFI) is a technical indicator that is used to signal whether a certain security is overbought or oversold. A value above 80 indicates overbought security, while a value below 20 indicates oversold security. Algorithm: Typical Price = (Low + High + Close) / 3; Raw Money Flow = Volume x Typical Price; Money Ratio = 14-period Positive Money Flow / 14-period Negative Money Flow; Money Flow Index (MFI) = 100 – [100 / (1 + Money Ratio)]
Long Butterfly
Long 1 call with a strike price of (X − a). Long 1 call with a strike price of (X + a). Short 2 calls with a strike price of X. X is current market price of a stock, and a > 0. It expects a low volativity (approximately variation [-a/3, +a/3]) to make a profit.
Short Butterfly
A short butterfly consists of two long calls at a middle strike and short one call each at a lower and upper strike. The upper and lower strikes (wings) must both be equidistant from the middle strike (body), and all the options must have the same expiration date. Example: Sell 1 strike=65 call, Buy 2 strike=60 calls, Sell 1 strike=55 call. It expects a high volatility to generate a profit (out-of-range {<57, >63}).
Long Straddle
Buying both a call and a put option, anticipating significant price movement in either direction.
Short Straddle
Selling both a call and a put option, expecting the price to remain relatively stable within an expected range.
Long Strangle
A long strangle consists of one long call with a higher strike price and one long put with a lower strike. Example: Buy 1 contract (100 shares) of XYZ at strike 105 call (cost=1.50); Buy 1 contract (100 shares) of XYZ at strike 95 put (cost 1.30). Total cost is 2.80. If price becomes < 92 or price > 108, you can expect to be profitable.
Short Strangle
A short strangle gives you the obligation to buy the stock at strike price A (low) and the obligation to sell the stock at strike price B (high) if the options are assigned. You are predicting the stock price will remain somewhere between strike A and strike B, and the options you sell will expire worthless. By selling two options (sell Put at low and sell Call at high), you significantly increase the income you would have achieved from selling a put or a call alone. But that comes at a cost. You have unlimited risk on the upside and substantial downside risk. Example: If current price is 40, you sell put at 30, and sell call at 50. If price stays approximately within the range [28, 52], you can make a profit.
Iron Condor
Buy a put, strike A; Sell a put, strike B; Sell a call, strike C; Buy a call, strike D. (A < B < C < D). This strategy can limit your risk of loss on both the short and long directions.
10x10℠ AiSignals enhance your portfolio by identifying investment opportunities on
the brink of entering their acceleration phase.
Utilizing our advanced AI technology, we discover valuable insights to catch prime investment
opportunities and maximize rate of return.